

Align y-axis to leading edge in Swift Charts
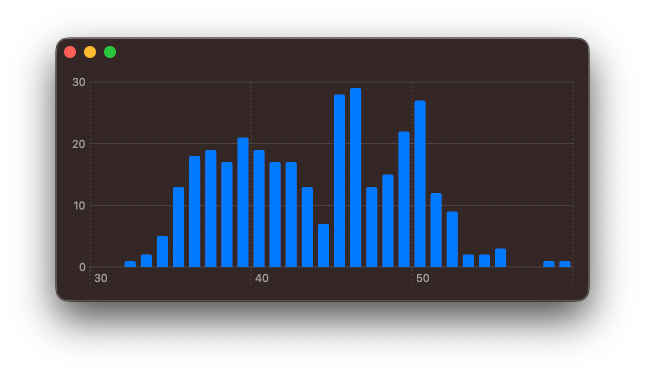
The default behaviour in Swift Charts appears to always draw the y-axis in the trailing edge of the chart. However, in many cases I would prefer my charts to render with this y-axis on the leading edge.
I have found that I can controle the position of the y-axis ticks using chartYAxis() modifier in combination with AxisMarks(position: .leading).
struct SimpleChart: View {
    var body: some View {
        Chart { ... }
        .chartYAxis {
            AxisMarks(position: .leading)
        }
    }
}
If you are looking to deepen your understanding of Swift Charts and learn how to reason about your data and turn it into beautiful, performant, and accessible charts, take a look at our new book Swift Charts Beyond the Basics. It is a rich, practical reference for building advanced data visualizations with the framework.
For more resources on Swift and SwiftUI, check out our other books and book bundles.
Turn app data into insight$35
Build clear, beautiful, and interactive visualizations with Swift Charts
Swift Charts Beyond the Basics
- Reveal patterns and relationships in complex app data
- Create custom charts that stay responsive and accessible
Turn app data into insight
Build clear, beautiful, and interactive visualizations with Swift Charts
Swift Charts Beyond the Basics