

Use SwiftUI views as points in scatter plot
When using PointMark we can customise the symbol with either symbol() or symbol(by:) modifiers. All symbols, even custom symbols conforming to ChartSymbolShape, must return a Path.
However, sometimes it's easier to just render a SwiftUI view in place of the symbol. To do this, we can attach an annotation to the PointMark with position overlay and centre alignment.
struct ForecastChart:  View {
    let forecast: [DayForecast]

    var body: some View {
        Chart(forecast) { element in
            PointMark(
                x: .value(
                    "Date", element.date, unit: .day
                ),
                y: .value(
                    "Avg Daytime Temperature",
                    element.dayAvgTemp
                )
            )
            .annotation(position: .overlay, alignment: .center) {
                VStack(spacing: 4) {
                    Image(
                        systemName: element.dayConditionIconName
                    )
                    Image(
                        systemName: element.nightConditionIconName
                    )
                }
                .symbolRenderingMode(.multicolor)
                .imageScale(.large)
            }
            .symbolSize(0) // hide the existing symbol
        }
        .chartXScale(range: .plotDimension(padding: 20))
    }
}
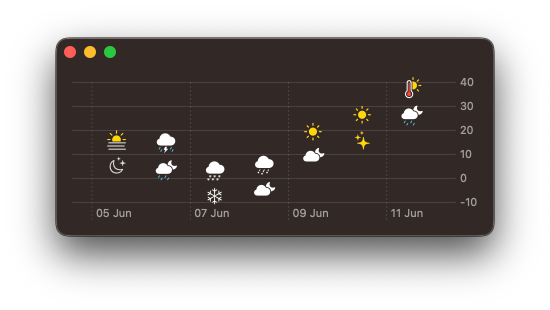
In the above example you might also spot the padding we applied to x-axis, so that symbols don't intersect the edges of the chart. chartXScale(range:) modifier accepts a load of useful plotDimension options.
An alternative to setting symbolSize(0) is to create a custom EmptySymbol, that conforms to ChartSymbolShape and returns an empty path. It can then be set on the PointMark using symbol(EmptySymbol())
struct EmptySymbol: ChartSymbolShape {
    var perceptualUnitRect: CGRect = .zero

    func path(in rect: CGRect) -> Path {
        .init()
    }
}
If you are looking to deepen your understanding of Swift Charts and learn how to reason about your data and turn it into beautiful, performant, and accessible charts, take a look at our new book Swift Charts Beyond the Basics. It is a rich, practical reference for building advanced data visualizations with the framework.
For more resources on Swift and SwiftUI, check out our other books and book bundles.
Turn app data into insight$35
Build clear, beautiful, and interactive visualizations with Swift Charts
Swift Charts Beyond the Basics
- Reveal patterns and relationships in complex app data
- Create custom charts that stay responsive and accessible
Turn app data into insight
Build clear, beautiful, and interactive visualizations with Swift Charts
Swift Charts Beyond the Basics