

Use SwiftUI views as points in scatter plot
When using PointMark we can customise the symbol with either symbol() or symbol(by:) modifiers. All symbols, even custom symbols conforming to ChartSymbolShape, must return a Path.
However, sometimes it's easier to just render a SwiftUI view in place of the symbol. To do this, we can attach an annotation to the PointMark with position overlay and centre alignment.
struct ForecastChart:  View {
    let forecast: [DayForecast]

    var body: some View {
        Chart(forecast) { element in
            PointMark(
                x: .value(
                    "Date", element.date, unit: .day
                ),
                y: .value(
                    "Avg Daytime Temperature",
                    element.dayAvgTemp
                )
            )
            .annotation(position: .overlay, alignment: .center) {
                VStack(spacing: 4) {
                    Image(
                        systemName: element.dayConditionIconName
                    )
                    Image(
                        systemName: element.nightConditionIconName
                    )
                }
                .symbolRenderingMode(.multicolor)
                .imageScale(.large)
            }
            .symbolSize(0) // hide the existing symbol
        }
        .chartXScale(range: .plotDimension(padding: 20))
    }
}
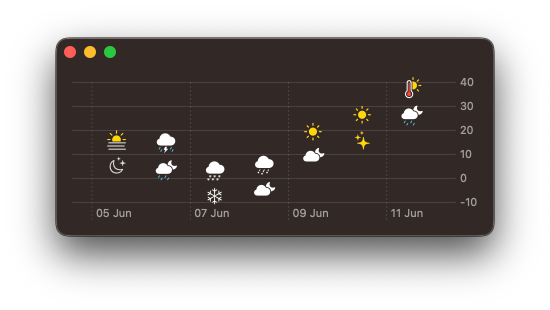
In the above example you might also spot the padding we applied to x-axis, so that symbols don't intersect the edges of the chart. chartXScale(range:) modifier accepts a load of useful plotDimension options.
An alternative to setting symbolSize(0) is to create a custom EmptySymbol, that conforms to ChartSymbolShape and returns an empty path. It can then be set on the PointMark using symbol(EmptySymbol())
struct EmptySymbol: ChartSymbolShape {
    var perceptualUnitRect: CGRect = .zero

    func path(in rect: CGRect) -> Path {
        .init()
    }
}
Swift Charts are designed to work with SwiftUI, but you can still use them in a UIKit project. You can check out Natalia Panferova's recent book Integrating SwiftUI into UIKit Apps for ways to add SwiftUI views to an existing UIKit project to take full advantage of the new iOS 16 APIs.
Enhance older apps with SwiftUI!$40
A detailed guide on gradually adopting SwiftUI in UIKit projects
Updated for iOS 18 and Xcode 16!
Integrating SwiftUI into UIKit Apps
- Upgrade your apps with new features like Swift Charts and Widgets
- Support older iOS versions with effective backward-compatible strategies
- Seamlessly bridge state and data between UIKit and SwiftUI using the latest APIs
Enhance older apps with SwiftUI!
A detailed guide on gradually adopting SwiftUI in UIKit projects
Integrating SwiftUI
into UIKit Apps
Updated for iOS 18 and Xcode 16!