

Using Measurements from Foundation for values in Swift Charts
In this post we are going to build a bar chart, comparing durations of nature walks in the Christchurch area. We will be using the new Swift Charts framework introduced this year and will see how to plot data of types that don't conform to Plottable protocol by default such as Measurement<UnitDuration>.
# Define data for the chart
Let's start by defining the data to visualize in the chart.
We declare a Walk struct containing the title and the duration of the walk in hours. We use the Measurement type from Foundation framework with the unit type of UnitDuration to represent the duration of each walk.
struct Walk {
    let title: String
    let duration: Measurement<UnitDuration>
}
We store the walks to show in the chart in an array.
let walks = [
    Walk(
        title: "Taylors Mistake to Sumner Beach Coastal Walk",
        duration: Measurement(value: 3.1, unit: .hours)
    ),
    Walk(
        title: "Bottle Lake Forest",
        duration: Measurement(value: 2, unit: .hours)
    ),
    Walk(
        title: "Old Halswell Quarry Loop",
        duration: Measurement(value: 0.5, unit: .hours)
    ),
    ...
]
# Try to use measurements in the chart directly
Let's define a Chart and pass it the walks array for the data parameter. Since we know that our walk titles are unique, we can just use them as ids, but you can also conform your data model to Identifiable instead.
Chart(walks, id: \.title) { walk in
    BarMark(
        x: .value("Duration", walk.duration),
        y: .value("Walk", walk.title)
    )
}
Note, that because Measurement<UnitDuration> doesn't conform to Plottable protocol, we will get an error Initializer 'init(x:y:width:height:stacking:)' requires that 'Measurement<UnitDuration>' conform to 'Plottable'.
The BarkMark initializer expects to receive a PlottableValue for x and y parameters. And the value type of PlottableValue has to conform to Plottable protocol.
We have a few options to fix the error. We can either extract the value of the measurement that is a Double and conforms to Plottable by default, we can extend Measurement<UnitDuration> with Plottable conformance or we can define a type wrapping the measurement and conform it to Plottable instead.
If we simply extract the value from the measurement, we'll lose the context and won't know what units were used to create the measurement. This means that we won't be able to properly format the labels of the chart to represent the unit to the users. We could remember that we used hours when creating the measurement, but it's not ideal. We can decide to change the data model later to store the duration in minutes, for example, or the data could be coming from somewhere else, so manually reconstructing the units is not a perfect solution.
Extending Measurement<UnitDuration> with Plottable conformance would work, but according to Warning for Retroactive Conformances of External Types proposal in Swift it could break if Swift Charts adds this conformance in the future.
We are going to look into defining our own type that wraps the measurement and add Plottable conformance to our custom type.

Level up your Swift skills!$35
100+ tips to take your Swift code to the next level
Swift Gems
- Advanced Swift techniques for experienced developers bypassing basic tutorials
- Curated, actionable tips ready for immediate integration into any Swift project
- Strategies to improve code quality, structure, and performance across all platforms
Level up your Swift skills!
100+ tips to take your Swift code to the next level
Swift Gems
# Make a wrapper type with Plottable conformance
We'll define a custom PlottableMeasurement type and make it generic, so it can hold any measurement with any type of unit.
struct PlottableMeasurement<UnitType: Unit> {
    var measurement: Measurement<UnitType>
}
Then we'll add a Plottable conformance for PlottableMeasurement with units of type UnitDuration. We can add support for other units in the future.
extension PlottableMeasurement: Plottable where UnitType == UnitDuration {
    var primitivePlottable: Double {
        self.measurement.converted(to: .minutes).value
    }

    init?(primitivePlottable: Double) {
        self.init(
            measurement: Measurement(
                value: primitivePlottable,
                unit: .minutes
            )
        )
    }
}
Plottable protocol has two requirements: primitivePlottable property that has to return one of the primitive types such as Double, String or Date and a failable initializer that creates a value from a primitive plottable type.
I decided to convert the measurement to and from minutes, but you can choose any other unit that suits your needs. It's just important to use the same unit when converting to and from the primitive value.
We can now update our chart to use our custom Plottable type.
Chart(walks, id: \.title) { walk in
    BarMark(
        x: .value(
            "Duration",
            PlottableMeasurement(measurement: walk.duration)
        ),
        y: .value("Walk", walk.title)
    )
}
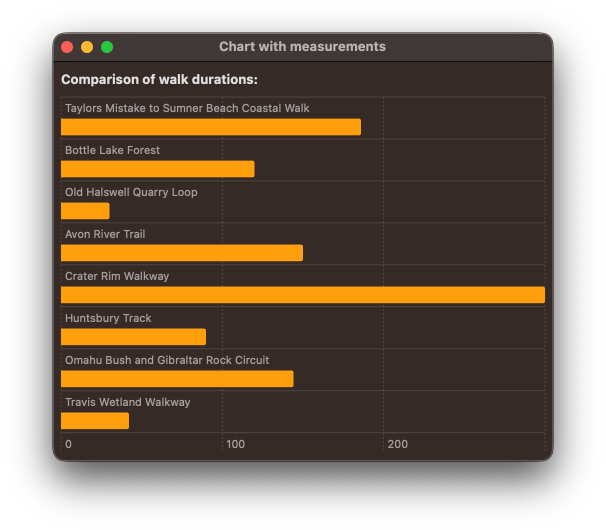
It works, but the labels on the x-axis are not formatted and don't show the units of measurements to the users. We are going to fix that next.
# Show formatted labels with measurement units
To customize the labels on the x-axis we will use chartXAxis(content:) modifier and reconstruct the axis marks with the values passed to us.
Chart(walks, id: \.title) { ... }
    .chartXAxis {
        AxisMarks { value in
            AxisGridLine()
            AxisValueLabel("""
            \(value.as(PlottableMeasurement.self)!
                .measurement
                .converted(to: .hours),
            format: .measurement(
                width: .narrow,
                numberFormatStyle: .number.precision(
                    .fractionLength(0))
                )
            )
            """)
        }
    }
We first add the grid line and then reconstruct the label for a given value.
AxisValueLabel accepts a LocalizedStringKey in the initializer, that can be constructed by interpolating a measurement and indicating its format style.
The value we receive is created using the initializer we defined in the Plottable conformance, so in our case the measurement is provided in minutes. But I believe it would be better to use hours for this particular chart. We can easily convert the measurement to the desired unit inside the interpolation. Here we are certain that the value is of type PlottableMeasurement, so we can force unwrap the type cast.
I chose the narrow format and zero digits after the comma for the number style, but you can adjust these settings for your specific chart.
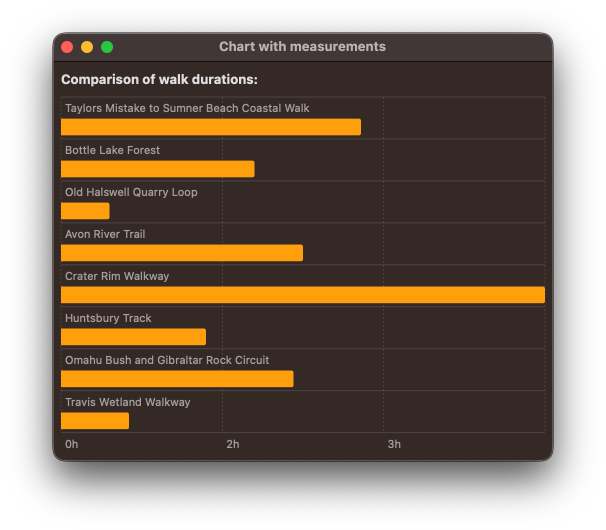
The final result displays formatted durations in hours on the x-axis.
You can get the full sample code for the project used in this post from our GitHub repo.
Swift Charts are designed to work seamlessly with SwiftUI, but they can also be integrated into a UIKit project. For detailed guidance on incorporating SwiftUI views into your existing UIKit app, check out my book Integrating SwiftUI into UIKit Apps. Additionally, if you're eager to enhance your Swift programming skills, my book Swift Gems offers over a hundred advanced tips and techniques to take your Swift code to the next level.
Enhance older apps with SwiftUI!$40
A detailed guide on gradually adopting SwiftUI in UIKit projects
Updated for iOS 26 and Xcode 26!
Integrating SwiftUI into UIKit Apps
- Upgrade your apps with new features like Swift Charts and Widgets
- Support older iOS versions with effective backward-compatible strategies
- Seamlessly bridge state and data between UIKit and SwiftUI using the latest APIs
Enhance older apps with SwiftUI!
A detailed guide on gradually adopting SwiftUI in UIKit projects
Integrating SwiftUI
into UIKit Apps
Updated for iOS 26 and Xcode 26!