

Filtering logs in Xcode 15
We have some great new features in the debug console in Xcode 15. I'm particularly excited about improved filtering functionality that makes it much easier to view console logs. In this post I'm going to highlight the main changes and show how we can take advantage of them.
To benefit from all the nice new features, we have to make sure that we are using unified logging and not print statements in our projects. For the demo purposes in this post, let's imagine that we have the following simple logs already in place.
import OSLog

...

let welcomeScreenLogger = Logger(subsystem: "MyTestApp", category: "WelcomeScreen")
let accountLogger = Logger(subsystem: "MyTestApp", category: "Account")

...

welcomeScreenLogger.info("Loading welcome screen data...")

...

welcomeScreenLogger.error("Loading error occurred: \(error)")

...

accountLogger.info("Logged in successfully")

...

accountLogger.fault("Something bad happened")
# Viewing metadata
Firstly, let's see how we can make Xcode show different kinds of metadata for logs to make it easier to find and read the messages that we are looking for.
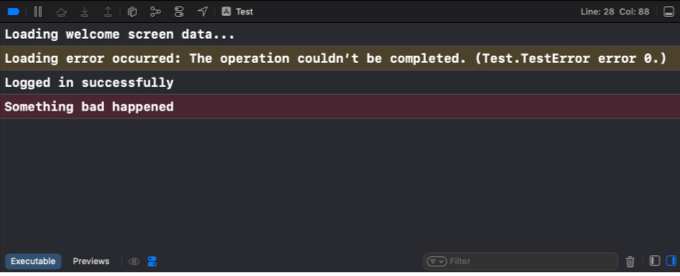
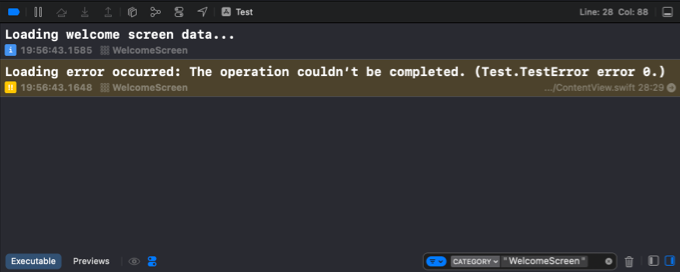
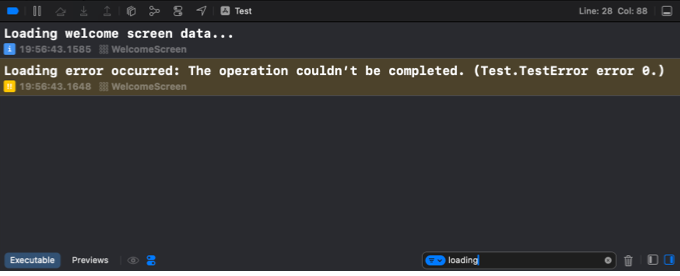
In the case when all of our demo logs appear in the console, we are going to see them in the following way. The metadata is hidden by default and different log levels have different background color. Error logs are colored in yellow while fault logs are colored in red.
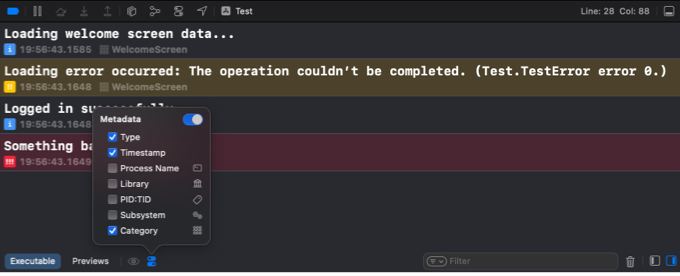
We can now choose what kind of metadata we want to see by pressing the "Metadata Options" button at the bottom of the console. For example, we can show type, timestamp and category of the logs by checking these checkboxes. The selected metadata will appear below the message for each log.
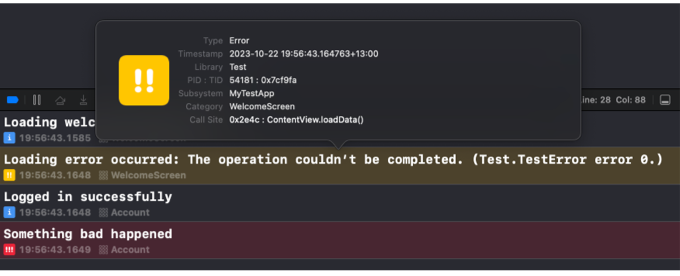
If we want to see all of the metadata available for a singe log, we can click on that log first, and then press space on the keyboard. Xcode will show a popover with all the relevant information including the call site.
# Showing or hiding similar items
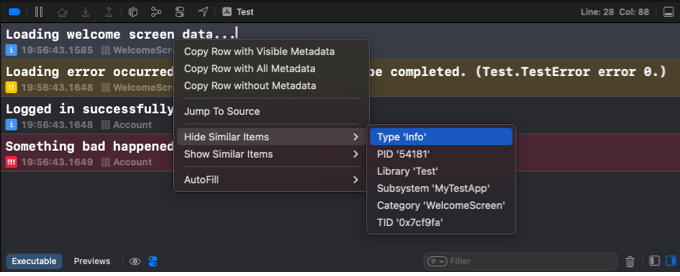
If we are interested in a particular log and want to see only items that are similar to it and hide the rest, we can do it by right-clicking on the log, then choosing the "Show Similar Items" option. There we can choose what information should be used as a filter. For example, if we only want to see the logs from the same category, we can select "Category 'WelcomeScreen'" as the filter.
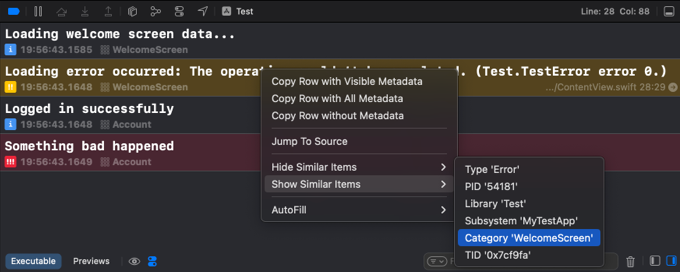
Once selected, the category filter will be automatically added in the filter bar at the bottom of the console. There, we can clear the filter if we want to see all the logs again.
If we want to hide only one type of logs and show everything else, we can right-click on a log and choose the "Hide Similar Items" option. For example, we can hide all of the info logs, to reduce the amount of noise in the console while we are focusing on errors and faults.
# Filtering by type
We can quickly filter logs by type from the quick filters option on the left of the filter bar. We can choose to only show errors or faults, for example.
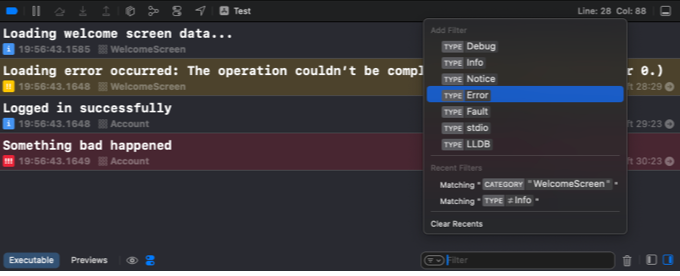
In the same popover we can also access the filters that we recently applied.
# Entering filters in the filter bar
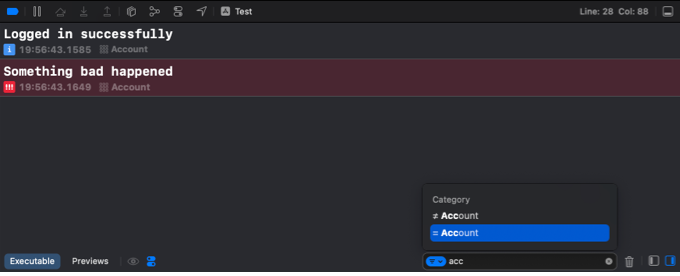
When entering a filter into the filter bar, we can make use of Xcode filtering suggestions. If we want to only show logs from a certain category, we can start typing the name in the filter bar and check the autocomplete options. For example, to quickly see all the logs for the Account component, I start typing "acc" and select Category == Account from Xcode suggestions.
If we are looking for a particular message, we can simply type a porting of the string into the filter bar. Only the logs that contain the string we typed will be shown.
If you're an experienced Swift developer looking to level up your skills, take a look at my book Swift Gems. It offers 100+ advanced Swift tips, from optimizing collections and leveraging generics, to async patterns, powerful debugging techniques, and more - each designed to make your code clearer, faster, and easier to maintain.


Level up your Swift skills!$35
100+ tips to take your Swift code to the next level
Swift Gems
- Advanced Swift techniques for experienced developers bypassing basic tutorials
- Curated, actionable tips ready for immediate integration into any Swift project
- Strategies to improve code quality, structure, and performance across all platforms
Level up your Swift skills!
100+ tips to take your Swift code to the next level
Swift Gems